Figure 9.

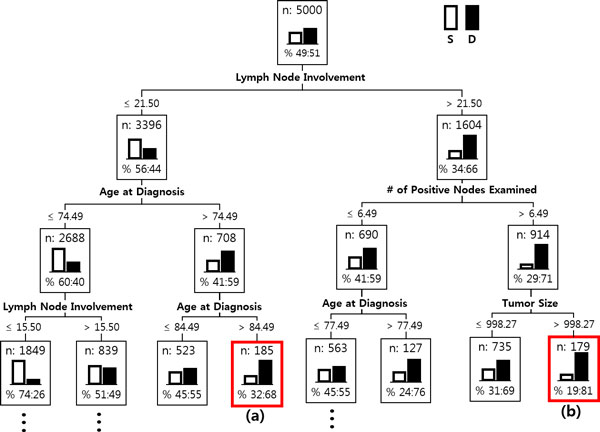
Patient Segmentation. Patient Segmentation: The first three levels of the resulting decision tree. In a node, the proportion of the survived and the dead are represented as the white bar and the black bar, respectively.

Patient Segmentation. Patient Segmentation: The first three levels of the resulting decision tree. In a node, the proportion of the survived and the dead are represented as the white bar and the black bar, respectively.