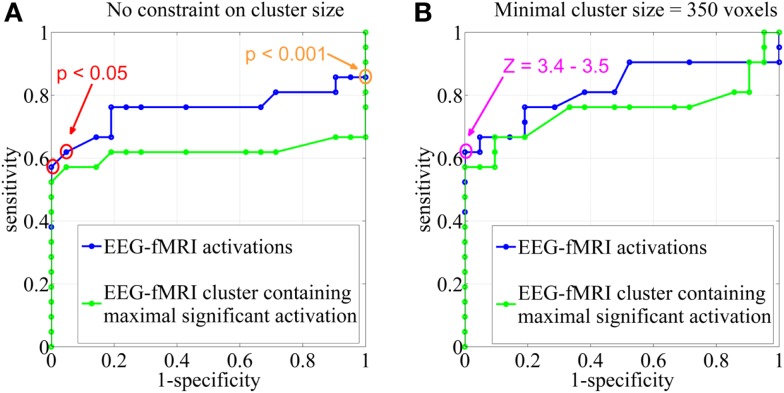
Figure 3.
Sensitivity and specificity. Receiver operating characteristic (ROC)-curves using different statistical Z-score thresholds at the voxel level (range, 0–13; step-size, 0.1) and (A) no constraint on cluster size, (B) a minimal cluster extent of 350 voxels. The results were based on all EEG-fMRI activations (blue) and upon the cluster containing the maximal significant activation only (green). The orange circle corresponds to the statistical threshold of uncorrected p < 0.001 (Z = 3.1), red circles to a significance level of FWE corrected p < 0.05 (Z = 4.9–5.1). The pink circle represents Z-score thresholds of 3.4 and 3.5. Note that not every change in Z-score threshold is associated with a change in sensitivity and specificity.

