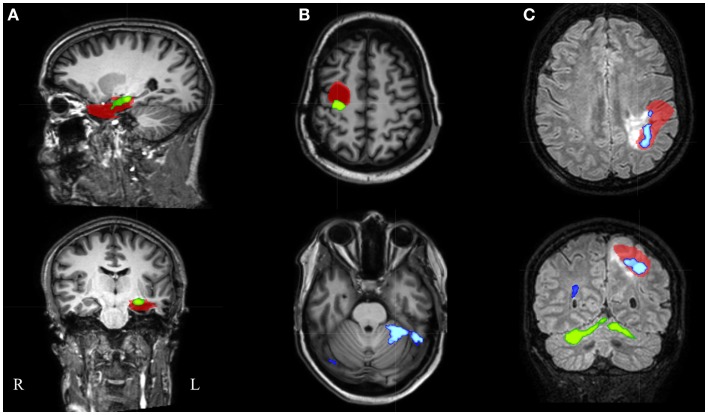
Figure 5.
Electroencephalography-functional magnetic resonance imaging results after thresholding at Z = 3.5 at the voxel level combined with a minimal cluster extent of 350 voxels are overlaid on representative slices of the structural MRI in three patients. (A) Patient 16 had only 1 suprathreshold activation. This cluster containing the maximal significant activation (green colored) was localized within the IOZ (red colored). (B) In patient 6, the cluster containing the maximal significant activation (green colored) was overlapping the IOZ, while an additional activation cluster (blue colored) was situated within the contralateral cerebellum. (C) Patient 15 was the only patient with a BOLD activation cluster (blue colored) overlapping the IOZ, which did not contain the maximal significant activation (green colored); R, right; L, left.

