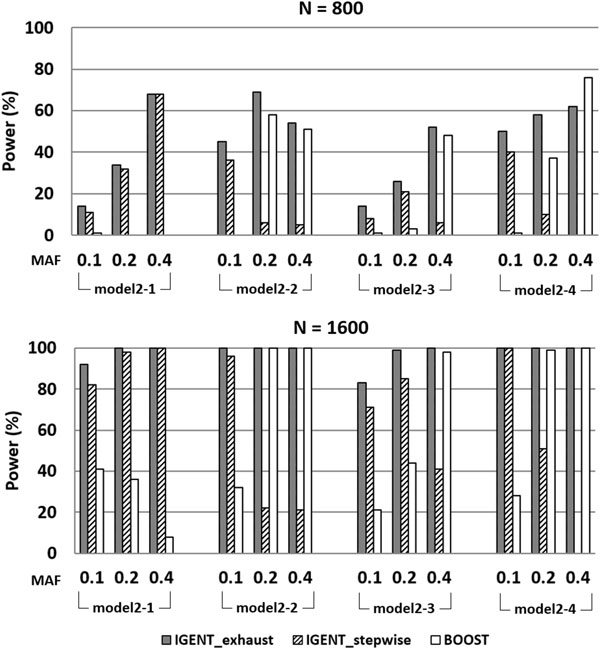
Figure 2.

The power comparison between IGENT and BOOST on four disease models with main effects. Results are shown in separate panels for each sample size (800 and 1600). MAF are presented on the x-axis. Model 2-1 is a multiplicative model. Model 2-2 is an epistasis model that has been used to describe handedness and the colour of swine. Model 2-3 is a classical epistasis model. Model 2-4 is the XOR model.
