
Figure 4.
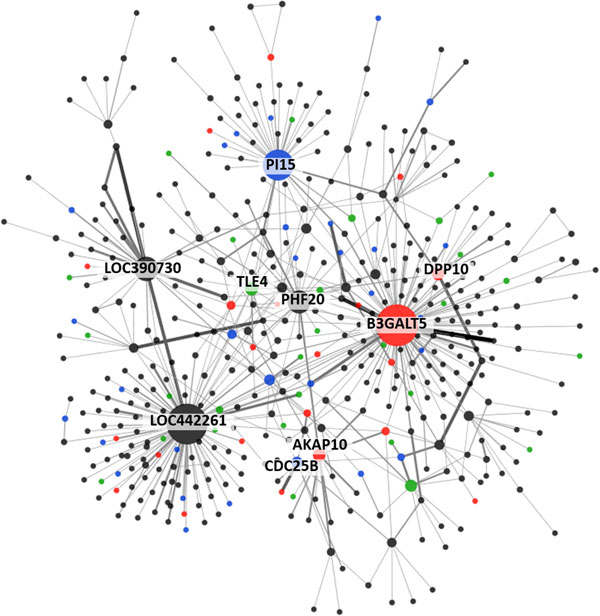
Gene-gene interaction network for WTCCC-BD dataset. Red nodes represent genes reported in previous GWAS literature with bipolar disorder dataset. Blue nodes are the genes related with bipolar disorder in previous literature. Green nodes are the genes related with other psychiatric disorders (schizophrenia and depression disorder). Width of edge is the significance level of interaction.