
Figure 2.
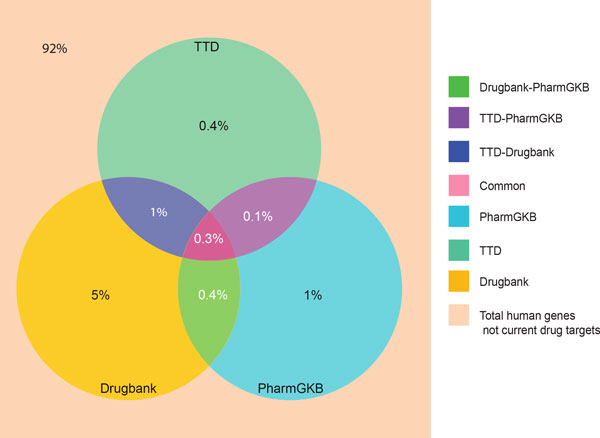
Coverage of the human genome by targets annotated in the three drug databases. The Venn diagram shows that gene targets annotated in drug databases comprise 8% of the entire human genome. It also describes the percentage of the genome covered by each database individually and upon pairwise comparison.