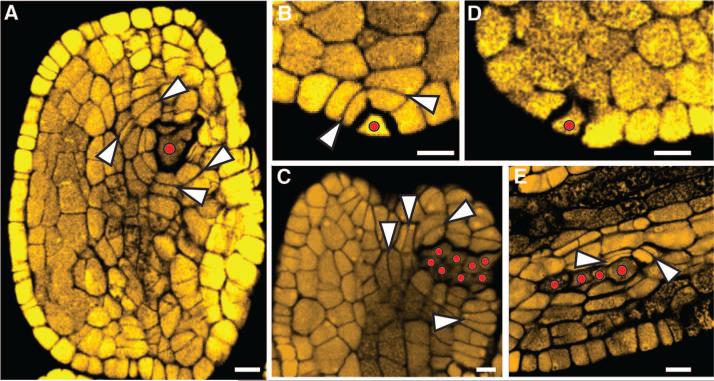
Fig. 3.
Ectopic archesporial cell and bilayer formation. (A) O2 needle treatment with archesporial cells near vasculature. (B) to (D) N2 needle treatment with (B) a single epidermal archesporial cell, (C) an ectopic archesporial cell cluster, and (D) a single ectopic archesporial cell in mac1, missing the somatic layer–adding divisions. (E) 20 μM SNP injected into msca1 caused ectopic archesporial cell formation in the lobe vascular bundle. In (A) to (C) and (E), white arrowheads indicate somatic divisions, with new cell walls built to add layers surrounding the archesporial cell(s). In all panels, red dots indicate archesporial cells. Scale bar, 10 μm.

