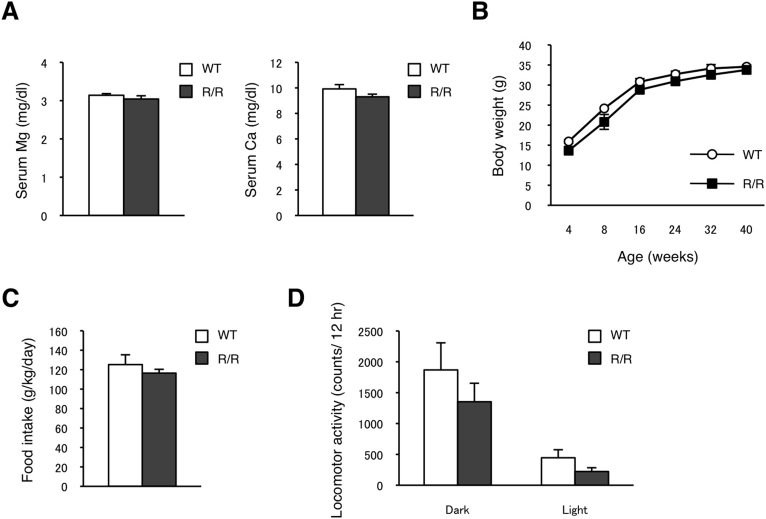
Figure 2. Serum total Mg2+ and Ca2+ levels and general behaviors in TRPM7R/R mice.
(A) Total Mg2+ and Ca2+ levels in serum obtained from WT and TRPM7R/R mice. Here and below values represent means ± s.e.m. (n = 10–14). (B) Male WT and TRPM7R/R mice were weighed at the indicated times (n = 6). (C,D) General behavior was analyzed in 16 to 18 week-old WT and TRPM7R/R mice. (C) Food intake data. (D) Locomotor activity data (n = 6).

