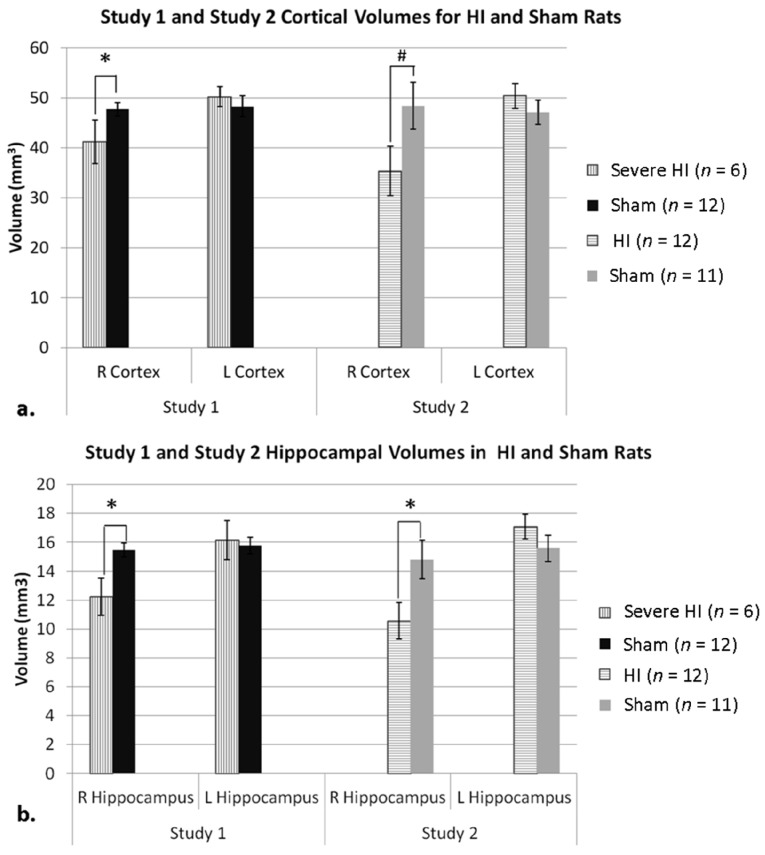
Figure 2.
(a) As expected in Study 1 (since the Severe HI subset was selected for cortical atrophy), a t-test on right cortical volume revealed a significant effect of Treatment (* p < 0.05, Severe HI smaller than sham). For Study 2, an ANOVA comparing HI and sham animals revealed a Hemisphere × Treatment interaction, and a t-test also showed a trend (# p = 0.07) for HI to have smaller right cortical volume. Analysis of right cortical volume across Study confirmed a robust overall HI effect (p < 0.05) and a lack of between-study differences. (b) For Study 1, an ANOVA comparing hippocampal volumes in severe HI and sham animals revealed an overall Treatment effect (p = 0.05). A t-test comparing right hippocampal volume in both groups in Study 1 revealed a significant effect of Treatment (* p < 0.05), as was seen in Study 2 (* p < 0.05; HI smaller than sham). Analysis of right hippocampal volume across Study confirmed a robust overall HI effect (p < 0.005), and a lack of between-study differences.

