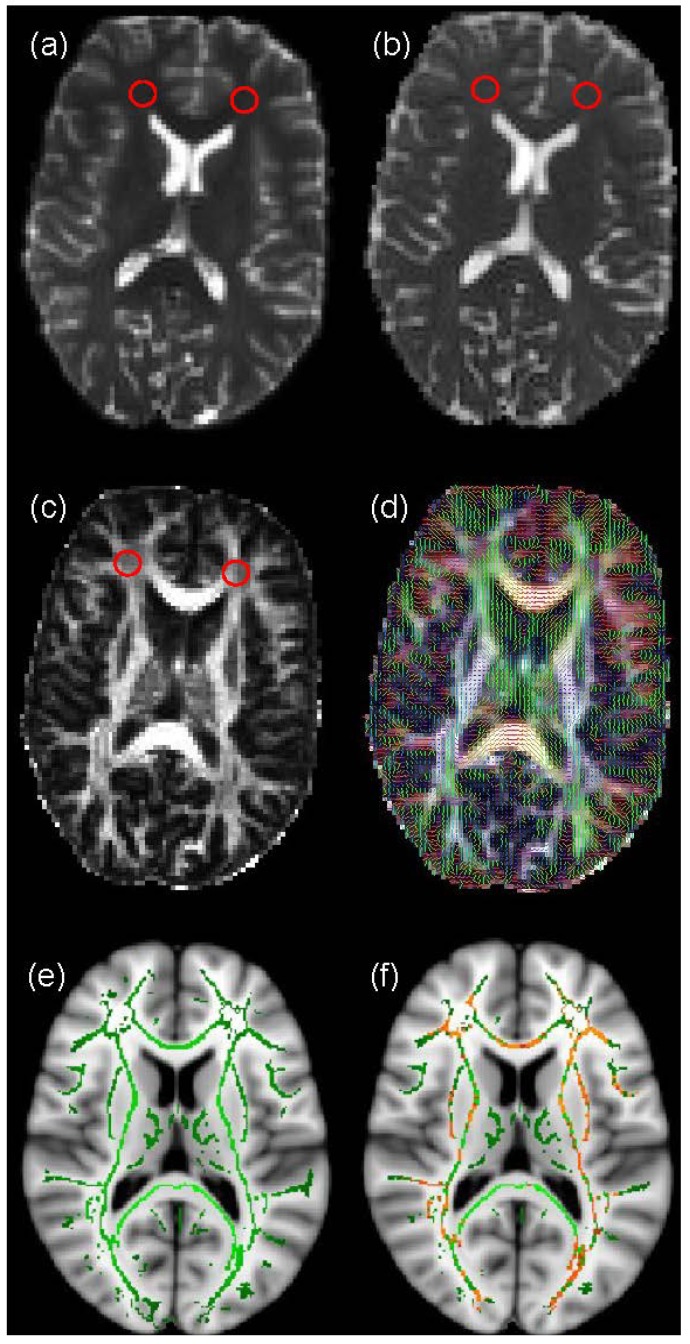
Figure 1.
An example of Diffusion Tensor Magnetic Resonance Imaging (DT-MRI) analysis. The figure displays maps of (a) T2-weighted signal intensity, (b) mean diffusivity (MD), (c) fractional anisotropy (FA) and (d) colour-coded principal diffusion direction overlaid on FA from a normal volunteer obtained using FMRIB’s Diffusion Toolbox (FDT) analysis pipeline [24]. Region of Interest (ROIs) placed in frontal white matter (WM) in (a) and transferred to (b) and (c) for measurement of MD and FA are indicated by red circles. In (d), the colours indicate water molecule diffusion occurring in the right/left (red), anterior/posterior (green) and superior/inferior (blue) directions. Also shown is an example of voxel-based analysis of FA data obtained using FSL’s Tract-Based Spatial Statistics (TBSS), specifically (e) a WM skeleton overlaid on an Montréal Neurological Institute (MNI) standard brain, and (f) voxels on this skeleton which are significantly different between two populations under study, represented in orange.

