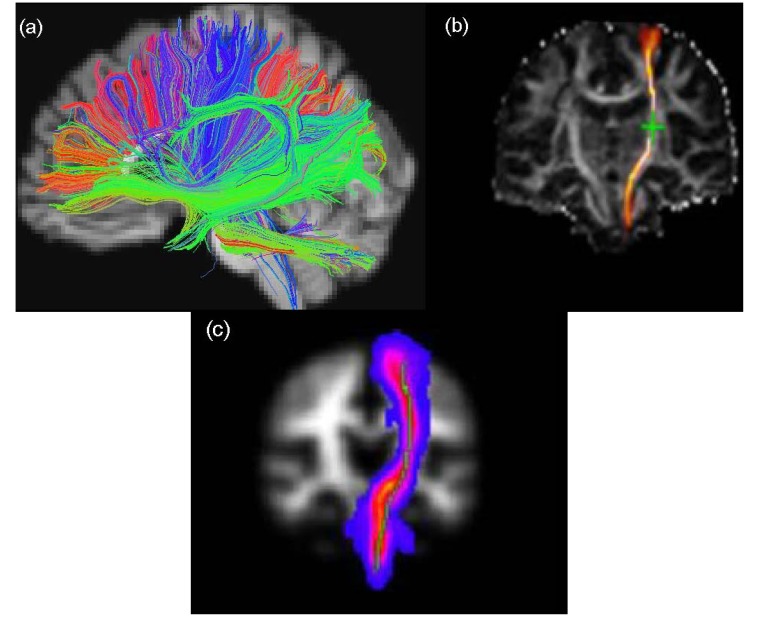
Figure 2.
Examples of the visualization of WM tractography data. The figure shows (a) whole brain WM overlaid on a high-resolution T1-weighted volume scan produced by TrackViz [31], (b) left corticospinal tracts of the same participant (CST) generated using FSL’s BedpostX/ProbTrackX algorithm and (c) maximum intensity projection of a standard space group map of left CST obtained from 90 participants aged over 65 years using TractoR [32,33].

