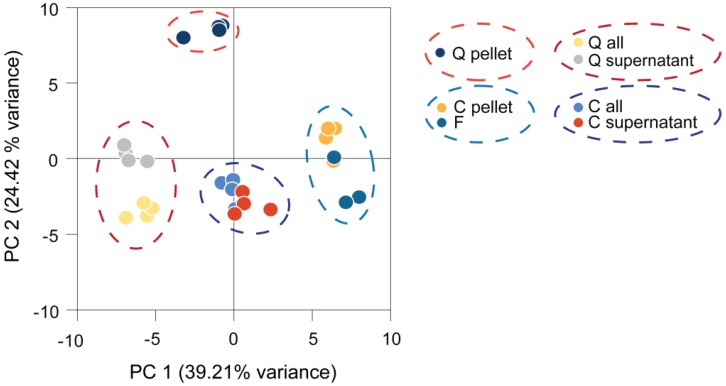
Figure 2.
Principal component (PC) analysis of Chlamydomonas metabolite profiles obtained by different harvesting methods. Four replicates were harvested and processed from the same culture by each harvesting method and measured by GC-MS. The generated metabolite profiles were normalized to the internal standard and log2-transformed before being subjected to principal component analysis. C, centrifuged; F, filtered; Q, quenched; all, cells and medium.

