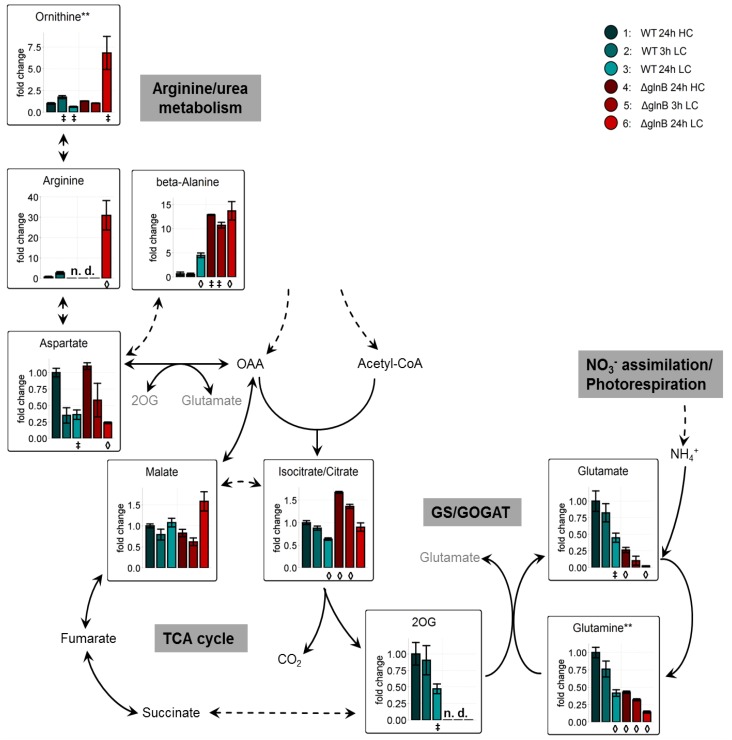
Figure 5.
Changes of primary N-metabolism and its precursors in cells of the wild type (WT) compared to the PII mutant (ΔglnB) of Synechocystis sp. PCC 6803 after shift from high CO2 (5%, HC) to low CO2 (0.038%, LC) conditions. Colored bars correspond to averaged x-fold values of three biological replicates measured by at least two technical replicates. Factors are calculated relative to WT 24h HC. Error bars represent standard error (n.d. = not detectable). Student’s T-test was applied to identify significant changes compared to WT 24 h HC.
‡: p-value ≤ 0.05, ◊: p-value ≤ 0.01. Abbreviations see Figure 1. ** Due to the chemical derivatization required for the GC-MS based profiling of primary metabolites the glutamine measurements represent the sum of endogenous pyroglutamate, glutamine, and minor contributions of glutamate. The ornithine measurements represent endogenous ornithine, citrulline, and arginine. The arginine measurement is taken from a specific chemical derivative.

