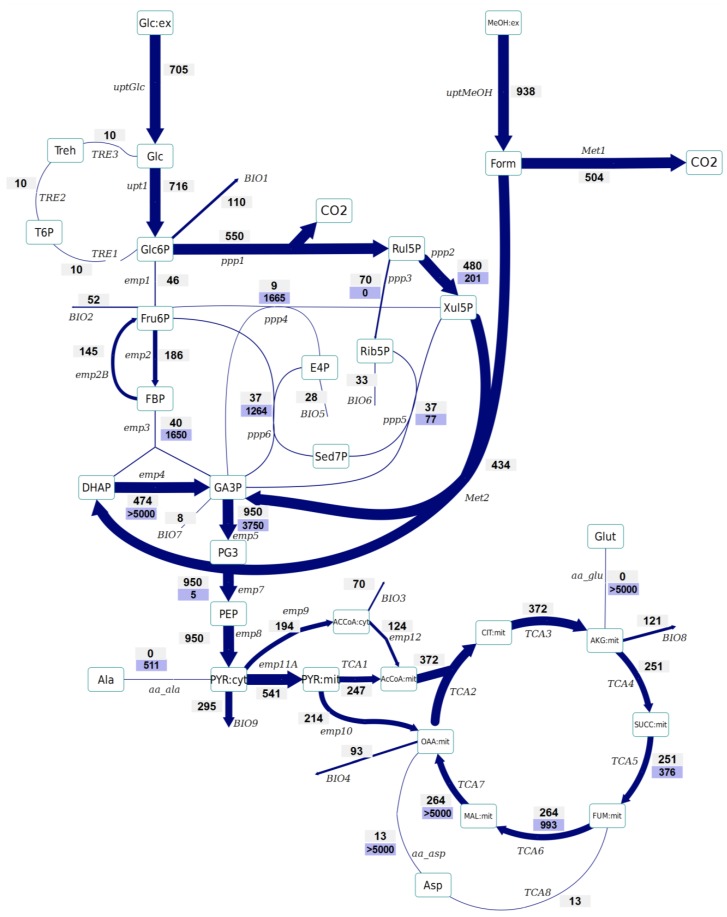
Figure 2.
Metabolic flux distributions of the control strain based on INST-13C-MFA. The flux values are given in μmol/gDCW/h. The width of the arrow represents the flux value. The upper values represent the net flux (in direction of the arrow), whereas the lower values (on blue background) reflect the backward flux (absolute). All the fluxes are also listed in Supplementary File 3.

