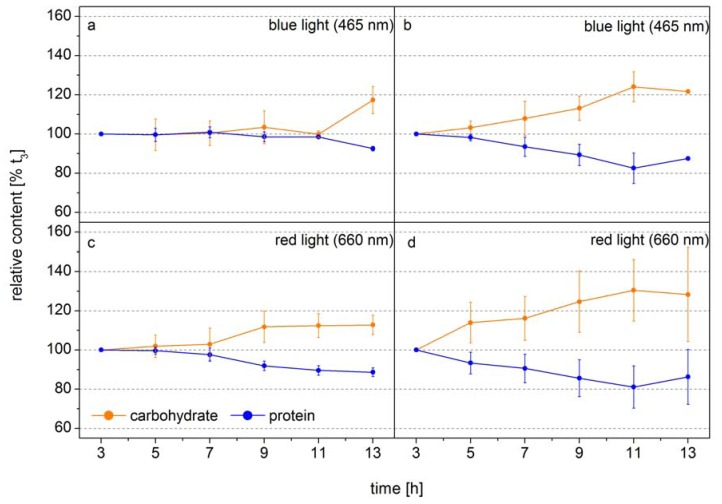
Figure 2.
Carbohydrate (orange) and protein (blue) levels of Phaeodactylum tricornutum grown at blue light (465 nm) of (a) 10 µmol absorbed photons m−2 s−1 (QPhar) and (b) 30 µmol absorbed photons m−2 s−1 or at red light (660 nm) of (c) 10 µmol absorbed photons m−2 s−1 and (d) 30 µmol absorbed photons m−2 s−1 in a 14 h light/10 h dark cycle. The time axes correspond to the time in the light phase. FTIR spectra were detected every 2 h and used for the calculation of the macromolecular composition (according to Wagner et al. 2010). The carbohydrate and protein levels were normalized to the values at 3 h into the light phase (t3) (modified according to [42].

