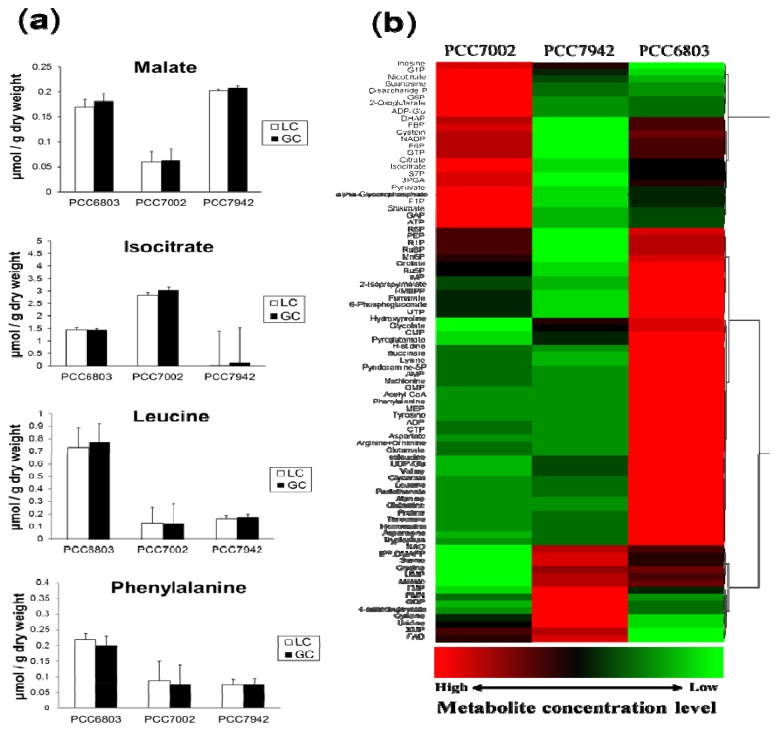
Figure 2.
(a) Comparison of the absolute concentration values from GC/QqQ-MS and LC/QqQ-MS systems. The bar graphs represent the mean values of triplicate samples and error bars indicate the standard deviations. These metabolites were successfully detected by both systems and resulted in similar values of absolute concentration; (b) Comparison of the metabolic profiles of the three cyanobacterial strains, namely, PCC7002, PCC7942 and PCC6803 under photoautotrophic conditions. Z-scored data were hierarchically clustered and the results are represented with a heat map.

