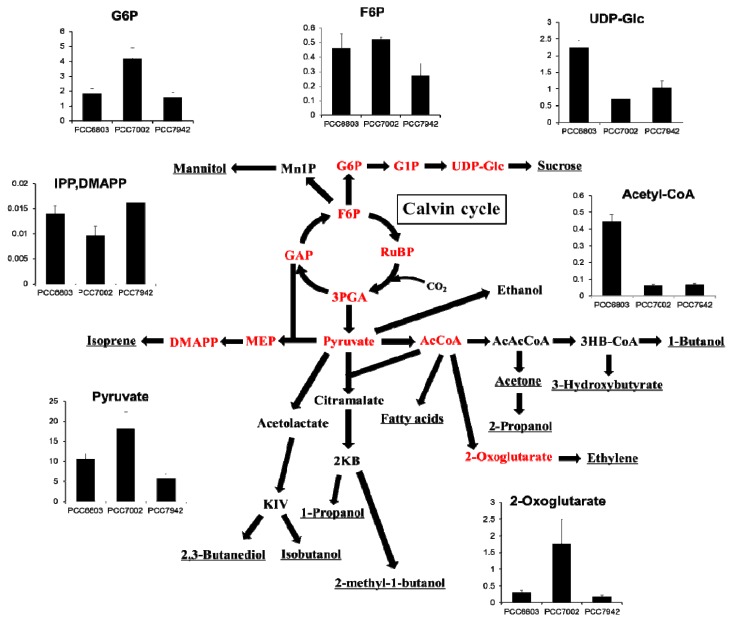
Figure 4.
Overview of the modified metabolic pathways related to previously reported cyanobacterial biological production. The targeted products are underlined while the metabolites in red can be quantitated by our method. The vertical axes of the bar graphs show the intercellular concentrations in μmol/g-dry cell weight of each metabolite (mean ± S.D., n = 3).

