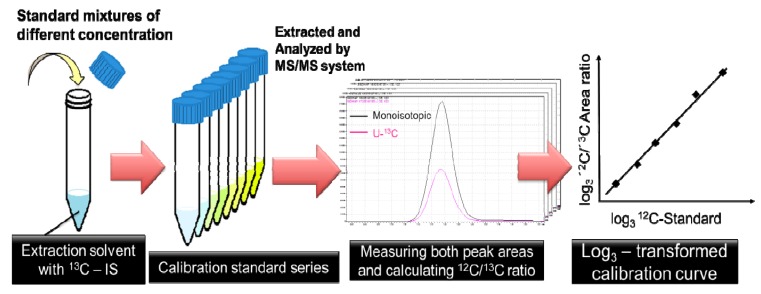
Figure 5.
The workflow of making calibration curves. Predetermined amounts of standards were directly added to centrifuging tubes containing 3 mL of extraction solvent with 13C-IS. The peak areas of the U-13C and monoisotopic (U-12C) metabolites were measured by MS/MS. 12C/13C ratios were plotted against their corresponding known amounts of naturally labeled standards on log3-log3 transformed liner calibration curves.

