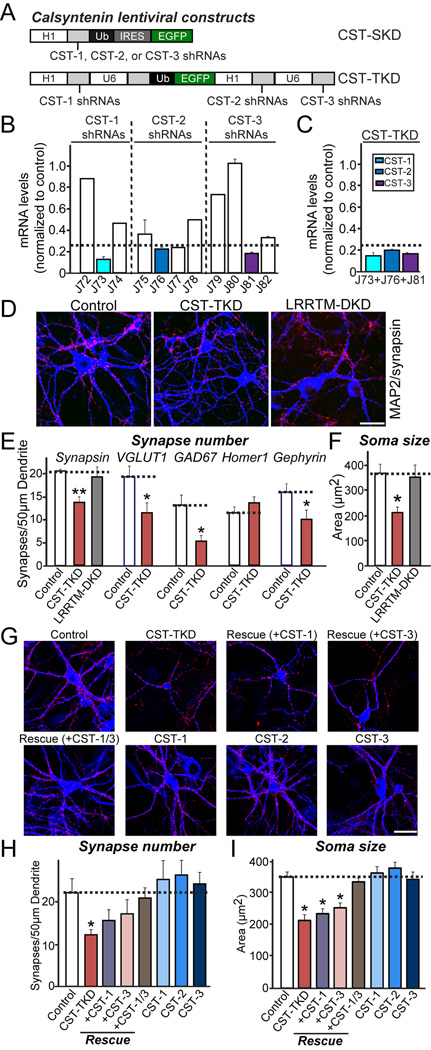
Figure 4. Knockdown of All Three CSTs, but Not Individual CST Isoform Alone, Reduces Synapse Density and Soma Size in Cultured Neurons.
(A) Schematic diagram of lentiviral shRNA vectors for KD of single CST isoforms (denoted CST-SKD) or triple KD of CST-1 to CST-3 (denoted CST-TKD). (B) KD efficacies of shRNA lentiviruses. Levels of target CST mRNAs (CST-1 to CST-3) were measured by quantitative RT-PCR in cultured mouse cortical neurons infected at DIV3 with lentiviruses expressing the indicated shRNAs. The mRNAs were prepared at DIV12-13. The dotted line represents the 75% KD cutoff level for tests of biological effects. (C) Measurements of target mRNA levels (CST-1, CST-2, and CST-3) in cultured cortical neurons as described in (B), except that neurons were infected with CST-TKD lentiviruses expressing shRNAs targeting CST-1, CST-2, and CST-3 [described in (A)]. The target mRNA measured is colored coded as indicated on the upper right. Dotted line represents the 75% KD cutoff level for tests of biological effects. (D) Representative images of cultured hippocampal neurons infected at DIV3 with lentiviruses expressing EGFP alone (control); coexpressing EGFP with shRNAs against CST-1, CST-2, and CST-3 (CST-TKD); or coexpressing EGFP with shRNAs against LRRTM1 and LRRTM2 (LRRTM-DKD). Neurons were analyzed through double immunofluorescence labeling for MAP2 (blue) and synapsin (red) at DIV14. Scale bar = 35 µm (applies to all images). (E–F) Summary graphs of the effects of CST-TKD in neurons on synapse density (E) (measured using synapsin as a general synapse marker, VGLUT1 as an excitatory presynaptic marker, GAD67 as an inhibitory presynaptic marker, Homer1 as an excitatory postsynaptic marker, and gephyrin as an inhibitory postsynaptic marker), and soma size (F) (measured using MAP2 signals). The data are shown as the means ± SEMs (3*p<0.001, assessed using analysis of variance [ANOVA] with Tukey’s test; 2–3 dendrites per transfected neuron were analyzed and group-averaged; “n” denotes the total number of neurons analyzed, as follows: Control/synapsin, n=16; CST-TKD/synapsin, n=18; LRRTM-DKD/synapsin, n=15; Control/VGLUT1, n=15; CST-TKD/VGLUT1, n=15; Control/GAD67, n=16; CST-TKD/GAD67, n=15; Control/Homer1, n=18; CST-TKD/Homer1, n=21; Control/Gephyrin, n=22; and CST-TKD/Gephyrin n=22). (G) Representative images of cultured hippocampal neurons infected with a vector expressing control lentiviruses (control); a vector expressing shRNA viruses against CST-1, CST-2, and CST-3 (CST-TKD); the CST-TKD vector together with lentiviruses expressing full-length human CST-1 [denoted as Rescue (+CST-1)], full-length human CST-3 [denoted as Rescue (+CST-3)], or both human CST-1 and human CST-3 [denoted as Rescue (+CST-1/3)]; or lentiviruses expressing only full-length human CST-1 (CST-1), full-length human CST-2 (CST-2), or full-length human CST-3 (CST-3). The neurons were analyzed through double immunofluorescence using antibodies to MAP2 (blue) and synapsin (red) at DIV14. Scale bar = 35 µm (applies to all images). (H–I) Summary graphs of the effects of the indicated lentiviruses on synapse density (H) (measured using synapsin as a general synapse marker, and soma size (I) (measured using MAP2 signals). Note that lentiviral expression of CST-3 did not increase synapse density, whereas high-level overexpression of CST-3 by calcium phosphate-mediated transfection significantly increased the synapse density (see Figure S7). The data are shown as the means ± SEMs (3*p<0.001, assessed using analysis of variance [ANOVA] with Tukey’s test; 2–3 dendrites per transfected neuron were analyzed and group-averaged; “n” denotes the total number of neurons analyzed, as follows: Control, n=19; CST-TKD, n=14; CST-TKD+CST-1 rescue, n=15; CST-TKD+CST-2 rescue, n=16; CST-TKD+CST-3 rescue, n=17; CST-TKD+CST-1/3 rescue, n=16; CST-1, n=15; CST-2, n=22; and CST-3, n=17).

