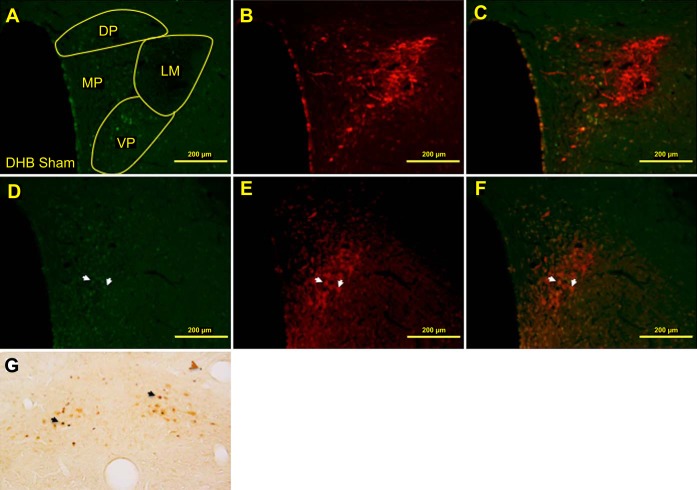
Fig. 5.
Example photomicrograph illustrating double-labeling for c-Fos (green) and vasopressin (red) in the PVN (approximately −188 mm from bregma) in a Sham-treated rat (A–C) and Cort-treated rat (D–F). A and D are c-Fos only, B and E are vasopressin only, and C and F show superimposed images. White arrows in D–F indicate sample neurons labeled for both c-Fos and vasopressin. The regions of the PVN for counting c-Fos expression are diagramed in the top left photomicrograph and were determined using the atlas by Paxinos and Watson (35). DP, dorsal parvocellular; MP, medial parvocellular; VP, ventral parvocellular; LM, lateral magnocellular. G: example photomicrograph of the nucleus of the solitary tract, illustrating double labeling for dopamine-β-hydroxylase (DβH; light brown) and c-Fos (dark brown/black). Black arrows indicate example neurons labeled for both DβH and c-Fos. The brown arrow indicates an example of labeling for c-Fos only.

