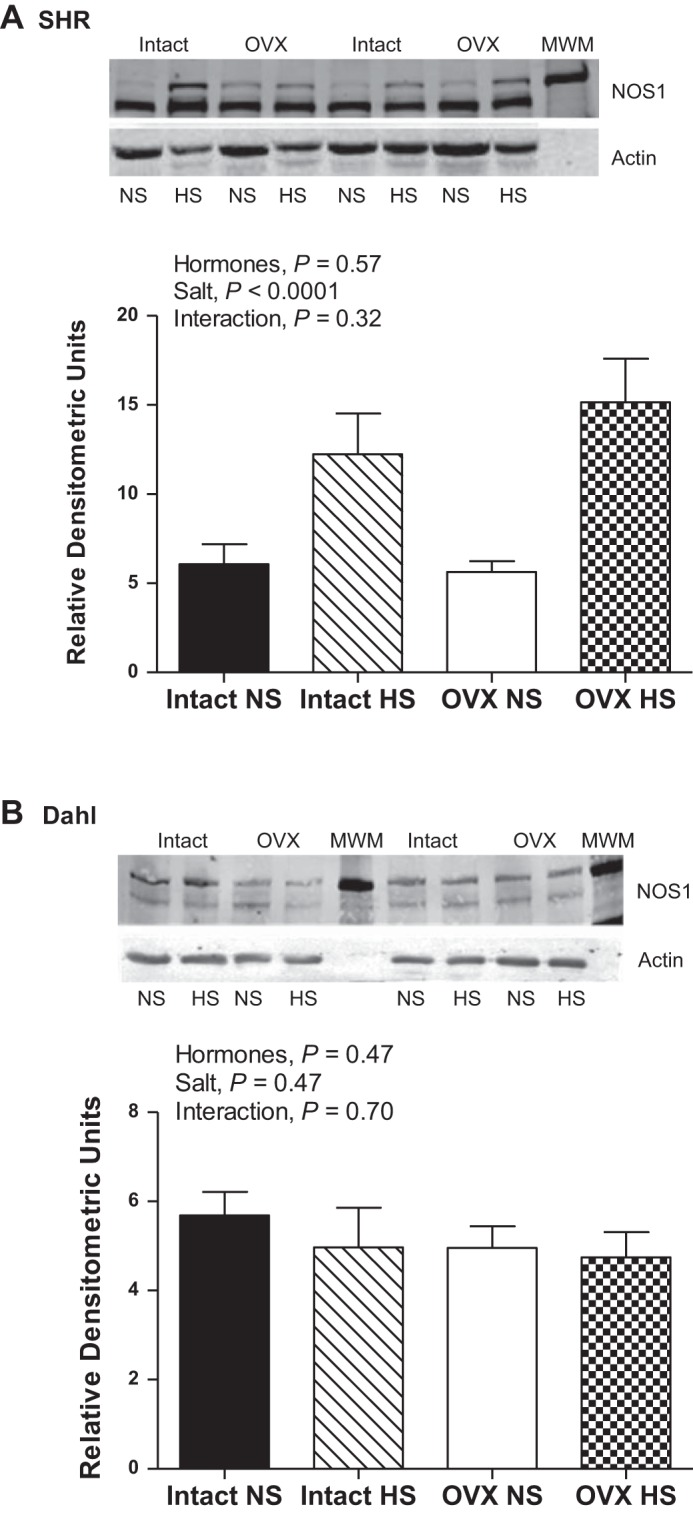
Fig. 3.

NOS1 protein expression in renal IM following 2 wk of NS or HS diet in intact and OVX SHR (A; n =11–13) and DS rats (B; n = 6 or 7). The top immunoreactive NOS1 band corresponds to NOS1α (160 kDa) and the bottom immunoreactive band corresponds to NOS1β (130 kDa).
