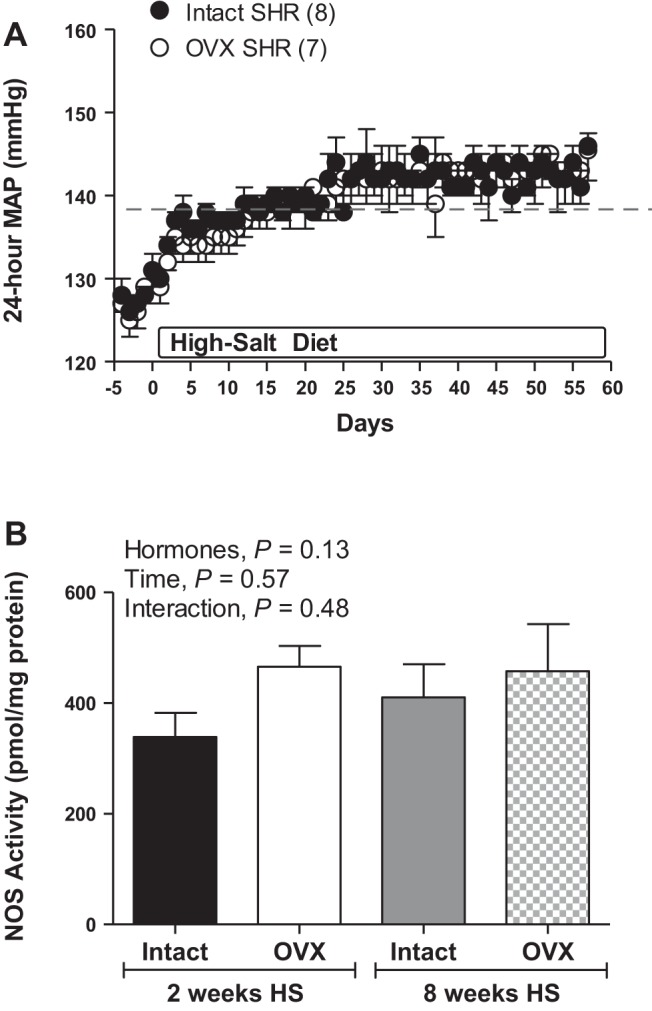
Fig. 8.

Twenty-four-hour MAP in response to a HS diet in gonad-intact and OVX SHR (A; n = 7). The dashed line represents the average increase in MAP after 2 wk. Total NOS enzymatic activity in renal IM following 2 or 8 wk of HS diet in intact and OVX SHR (B; n = 7–10).
