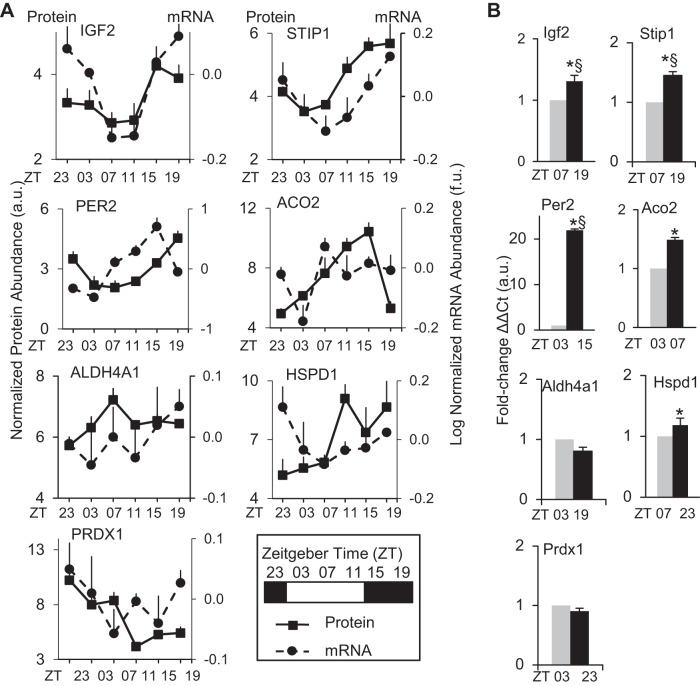
Fig. 3.
The diurnal cardiac proteome and transcriptome. A: diurnal profiles of microarray gene expression data (dashed line), compared with proteins identified by 2D-DIGE and LC/MS/MS, then validated by triplicate Western blot across all diurnal time points (solid line). Microarray gene expression values are provided as log-normalized mRNA abundance (f.u. = fluorescence units) using GeneSpring software. Rhythmic gene expression was assessed by JTK_CYCLE algorithm, and values are provided in Supplemental Data S2. For protein expression, values are provided as triplicate densitometry from Western blots (see Fig. 2D). For all graphs, the first (left) y-axis is normalized protein abundance (a.u., arbitrary units) and the second (right) y-axis is log-normalized mRNA abundance (f.u. = fluorescence units), and x-axis is time of day in zeitgebers as denoted in the legend key box inset. Values are expressed as means ± SE; n = 3/time point. B: quantitative real-time PCR was performed to validate the peak and trough mRNA expression time points from the microarrays. real-time PCR samples were run in triplicate, and all values were normalized to histone using the delta delta CT method. *P < 0.05, diurnal rhythm significant by JTK_CYCLE. §P < 0.05 peak:trough ratio validated by real-time PCR. See Supplemental Data S2 for mRNA analyses, including JTK_CYCLE, mRNA vs. protein ZT peaks, fold change, in silico data for the corresponding circadian promoter binding elements (canonical E box, E′box, D box, RORE), searches against published CLOCK/BMAL ChIP assays, and PCR primer sequences.

