Fig. 4.
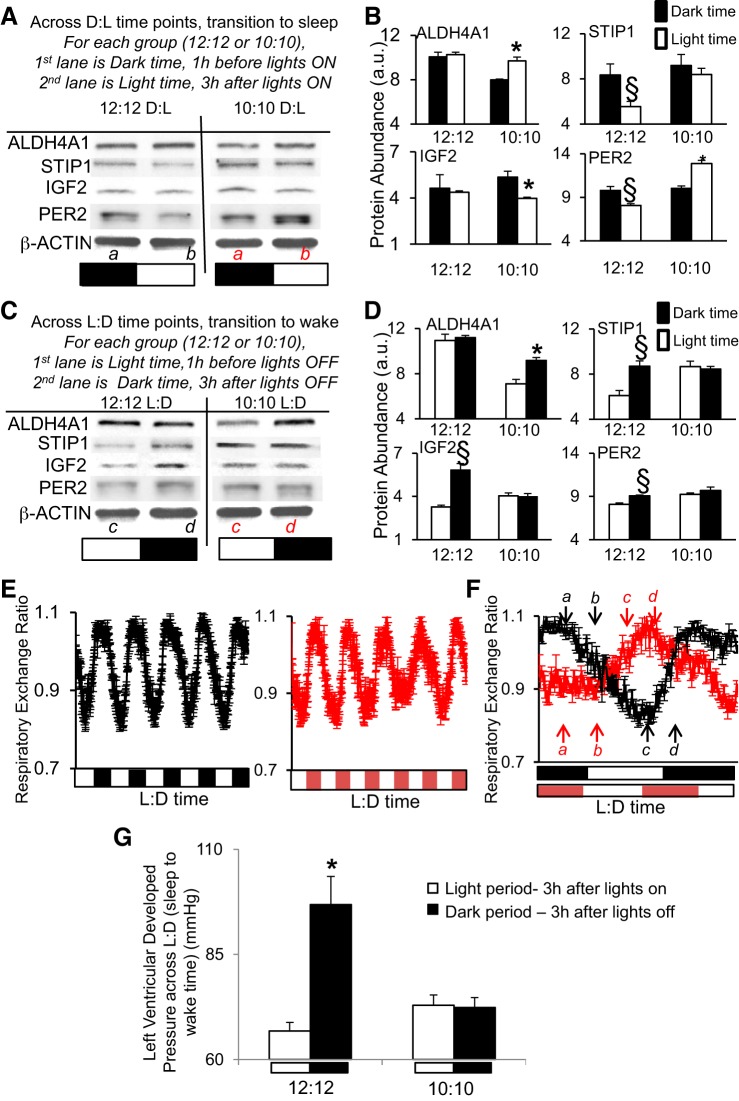
Diurnal disruption. Mice subjected to a shortened L:D environment (10:10 h) exhibited altered abundance of cardiac proteins ALDH4A1, STIP1, IGF2, PER2 relative to the L:D cycle, vs. mice housed in the normal 12:12-h environment. A: Western blot, showing dark (1 h before lights on) to light (3 h after lights on) transition times. B: densitometry relative protein abundance (in a.u.). C: Western blot, showing light (1 h before lights off) to dark (3 h after lights off) transition times. D: densitometry relative protein abundance (in a.u.). Images in A and C represent Western blots using pooled samples (n = 3 per time point). Graphs in B and D are from triplicate Western blots using individual samples (n = 3/time point) and scanned by densitometry (values are in Supplemental Data S4). Values are expressed as means ± SE; §P < 0.05 represents a statistical difference under normal 12:12-h L:D conditions, and *P < 0.05 represents a statistical difference in 10:10-h LD. PER2 is used as a positive cycling control. Bands are normalized to β-actin to control for loading. The lower case letters a,b,c,d in parts A and C denote the time points where samples were taken (red letters denote 10:10, while black letters denote 12:12 environment). These sampling times are relative to the L:D cycle, as illustrated in F. E: whole body metabolic substrate utilization rhythms (respiratory exchange ratio, RER) measured in a CLAMS over 12:12-h L:D cycle exhibited a diurnal rhythm that peaked in the dark (animals awake) and troughed in the light (sleep time) (left, black lines), and they continued to exhibit a clear endogenous rhythm in RER that did not follow the L:D cycle under the shortened 10:10-h L:D photoperiod (right, red lines). F: RER rhythms on the day of collection showing that sampling times are relative to the L:D cycle but differ in regards to the endogenous rhythm. n = 5/group, metabolic values are in Supplemental Data S4. The lower case letters a,b,c,d denote the times when samples were taken (red letters denote 10:10, while black letters denote 12:12 environment). G: there is normal diurnal variation in cardiac function on Langendorff (left ventricular developed pressure, LVDP) under 12:12-h L:D (left, lower during the light/animal sleep time, while higher during the dark phase/wake time); however, this difference is altered with respect to the L:D cycle in the 10:10 L:D diurnal disrupted group (right). Function was assessed in hearts collected in the light period (murine sleep time) at 3 h after lights on, and the dark period (murine wake time) at 3 h after lights off. Values are expressed as means ± SE. *P < 0.05 light vs. dark; n = 5 hearts/group.

