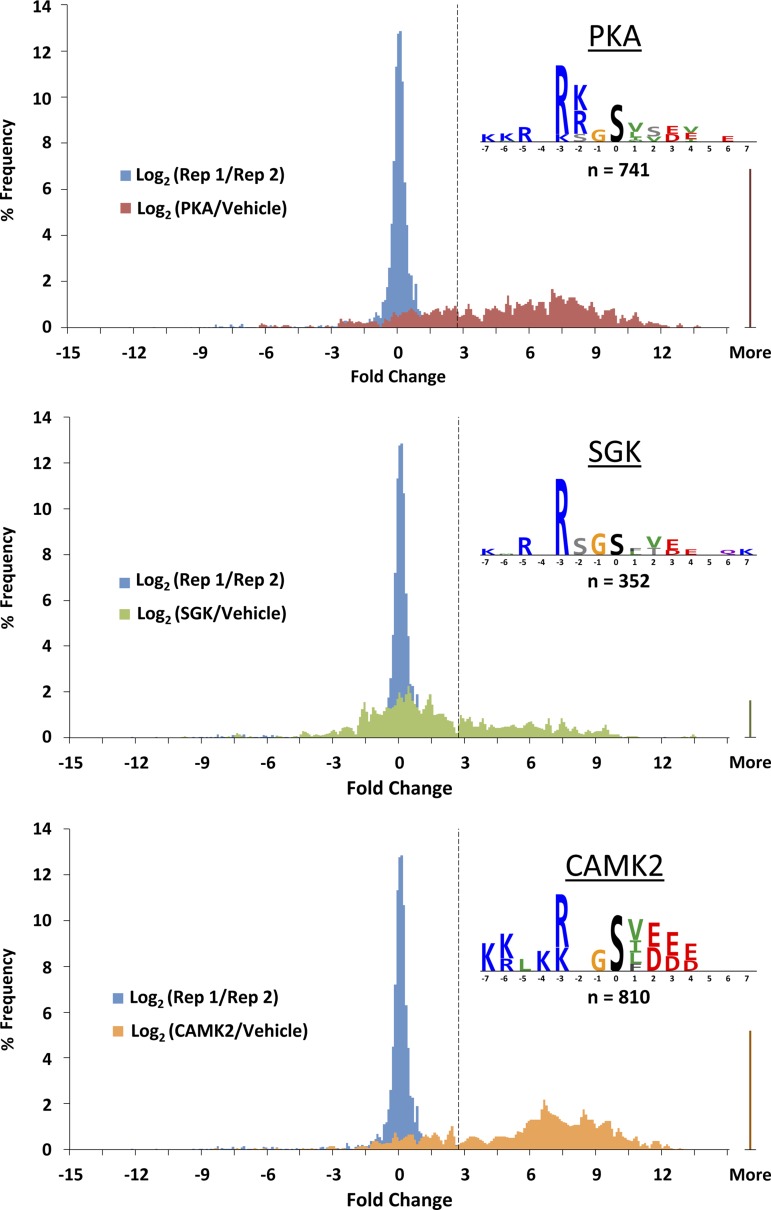
Fig. 7.
Histograms and logos from MS quantification. For each kinase, 2 histograms are overlaid: blue histograms repeating in each panel represent inherent variability of the method as measured by the base 2 logarithm of the ratio of the MS signal for a peptide in the 1st replicate (Rep 1) to the signal for the same peptide in the 2nd replicate (Rep 2); the other colored histograms are of the base 2 logarithms of the ratios of the MS signals with and without the kinase incubation. Dashed vertical line delineates 2 SDs above zero based on the replicate comparison (blue histograms). Logos of the phosphorylation consensus sequences based on the unique phosphorylation sites identified in the study for each kinase were created in PhosphoLogo and are shown for PKA, SGK, and CAMK2.

