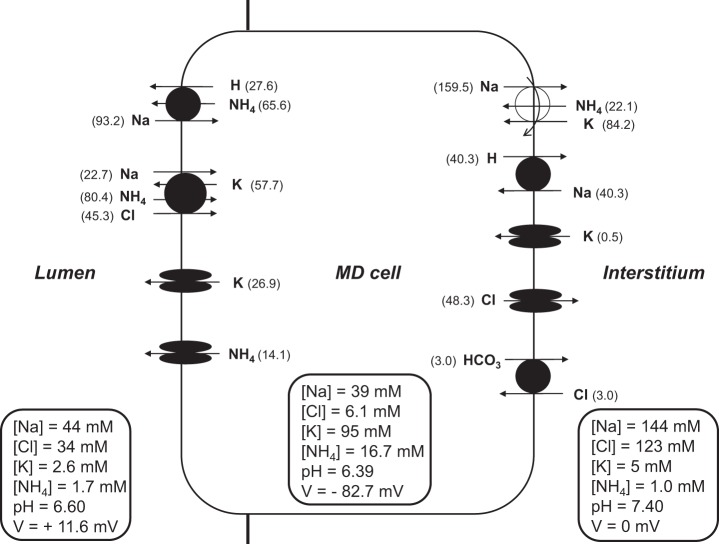
Fig. 1.
Schematic diagram of the model macula densa (MD) cell. Not shown are basolateral Na+-3HCO3− and 2Na+-HPO42− cotransporters and solute background permeabilities. Luminal and peritubular concentrations are chosen to reflect normal-flow conditions. The model computes intracellular concentrations and transcellular fluxes (shown in parentheses).

