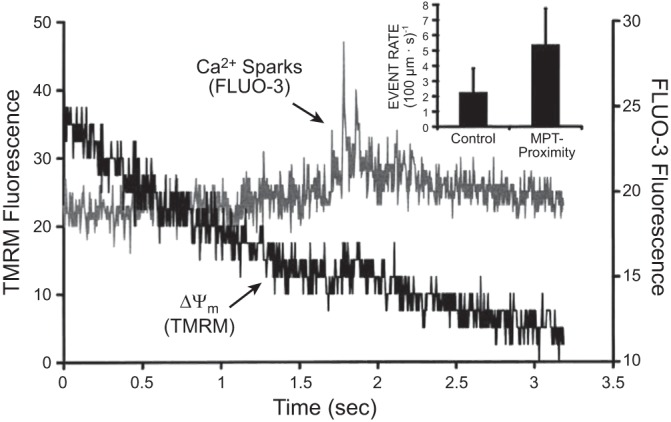
FIGURE 10.

Induction of Ca2+ sparks after the mPTP. Cell is dual-loaded with TMRM (Δψ) and fluo-3 (Ca2+) and line-scan imaged at 230 Hz. Representative example showing the dissipation of TMRM fluorescence from a single mitochondrion and a cluster of Ca2+ sparks in the immediate vicinity, within seconds of MPT induction. Inset: comparison of Ca2+ spark rate in proximity of the mPTP occurrence, i.e., within the sarcomere containing the involved mitochondria and within 3 s after the mPTP occurrence. [From Zorov et al. (491).]
