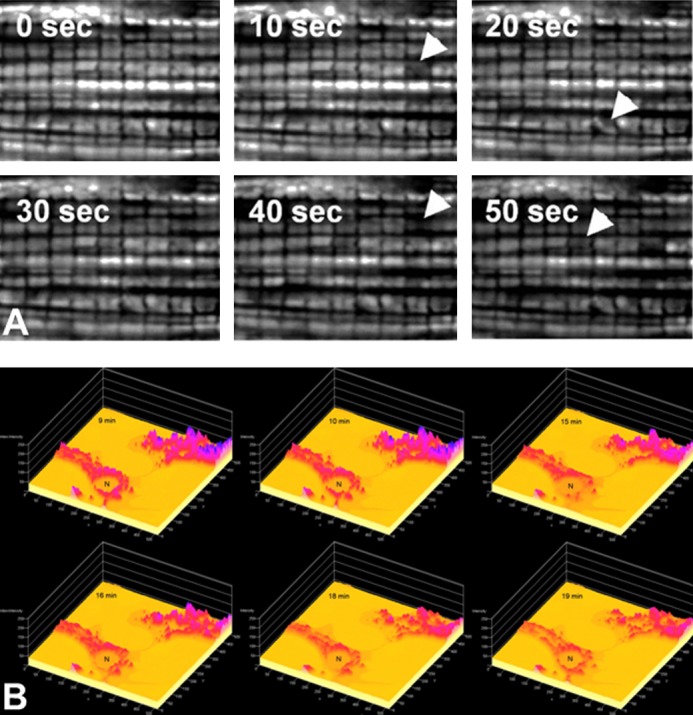
FIGURE 12.

Oscillations of Δψ in individual mitochondria over time in a portion of a cardiac myocyte induced by 10 μM clotrimazole. Panels of consecutive fluorescence frames with a different interval indicated in each plane 10 s acquired from either a 18 × 15 μm region of an adult cardiac myocyte [A; from Zorov et al. (493), with permission from Elsevier.] or neonatal cardiac myocytes loaded with TMRM (B). Arrows indicate individual mitochondria or mitochondrial clusters displaying periodic changes in the membrane potential.
