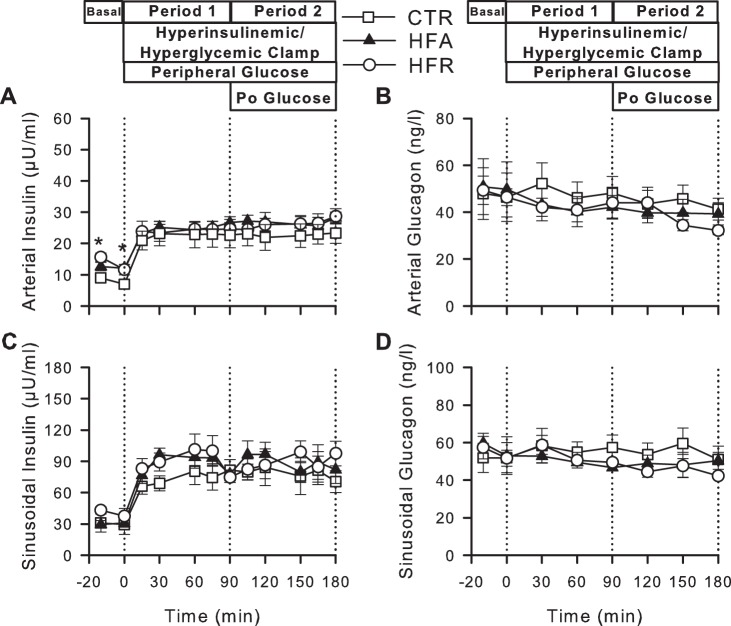
Fig. 2.
Plasma hormone concentrations during hyperinsulinemic hyperglycemic (HIHG) clamps. Arterial plasma insulin (A) and glucagon (B) and hepatic sinusoidal insulin (C) and glucagon (D) during basal (−20 to 0 min) and experimental periods (0–180 min) of HIHG clamps in CTR (◻), HFA (▲), or HFR (○) diet groups. Po, portal. Data are means ± SE; n = 5/group. *P < 0.05, CTR vs. other groups.

