
Fig. 6.
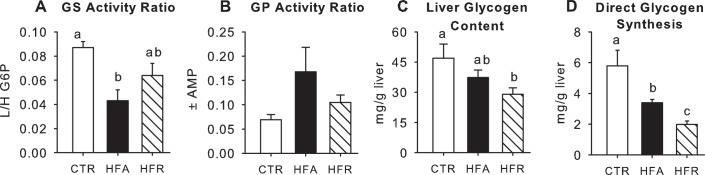
Markers of hepatic glycogen metabolism. Activity ratios of glycogen synthase (GS; A) and glycogen phosphorylase (GP; B), terminal liver glycogen concentrations (C), and glycogen synthesized via the direct pathway (D) for CTR (open bars), HFA (black bars), and HFR (hatched bars). Data are means ± SE; n = 5/group. Groups with the same letters are not significantly different from one another; where there are no letters, there are no significant differences among groups. L/H, ratio of low to high glucose 6-phosphate.