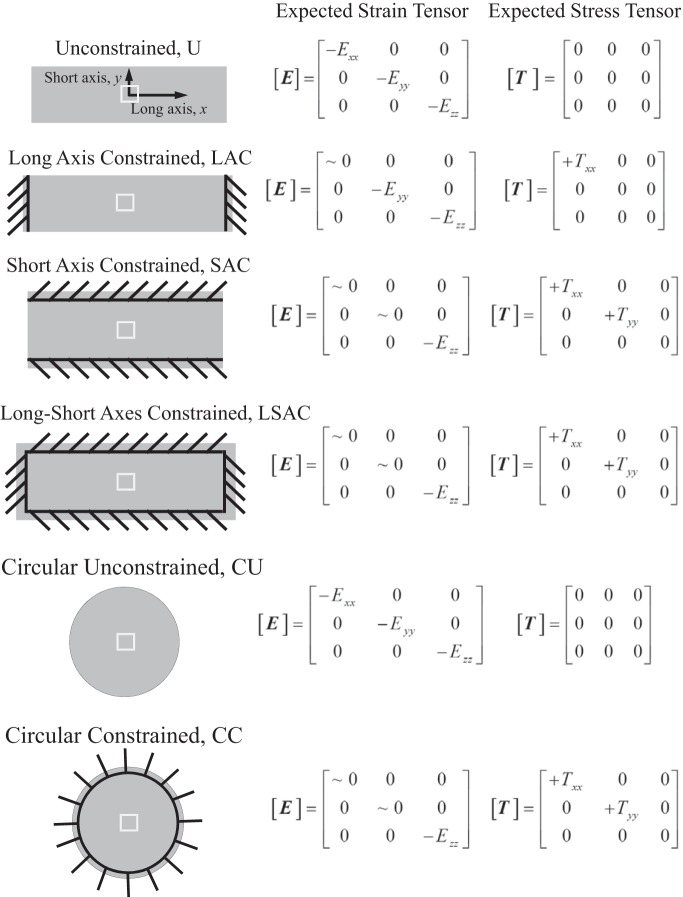
Fig. 2.
Schematic showing boundary conditions for each of the 6 groups (left), expected state of strain [E] at center of construct due to cell generated traction forces (middle), and expected state of stress [T] at center of construct due to cell generated traction forces (right) in Cartesian coordinates. The approximate location of 3D image acquisition by laser scanning confocal microscopy is shown as a small white box. The signs (+ or −) are indicated for the expected strains and stresses, with negative signs on the strain indicating compression and positive signs on the stresses indicating tensile force. The notation “∼0” indicates that the strain component is expected to be very small relative to the others, but not necessarily exactly 0.

