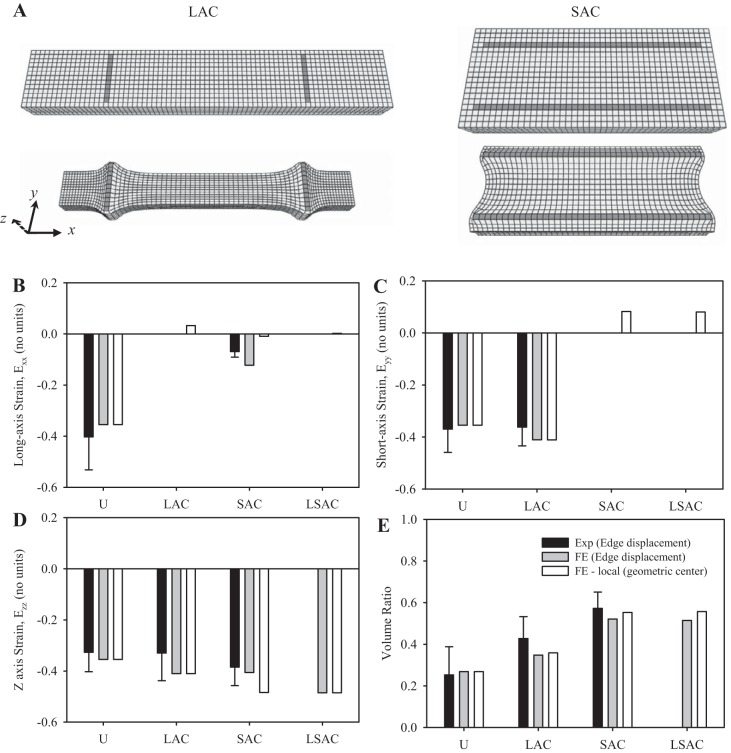
Fig. 9.
Finite element (FE) simulations of microvessel-induced contraction of the constrained vascularized constructs. A: LAC model is shown at left, and the SAC model is shown at right. The initial configuration is shown above, and the deformed configuration (i.e., day 6 of growth) is shown below. B–E: global engineering strain was calculated from both the experimental constructs (black) and FE models (gray) using edge displacement and the definition (L–Lo)/Lo. Local strain, or the principal components of the infinitesimal strain tensor, was measured for the geometric center of the FE models and reported in white. Engineering strain was calculated along the X-, Y-, and Z-dimension (B and C), and these results were used to calculate the volume change ratio that occurred over the deformation (E). Bars indicate standard error. No bars are present on the FE data (i.e., N = 1 simulation).

