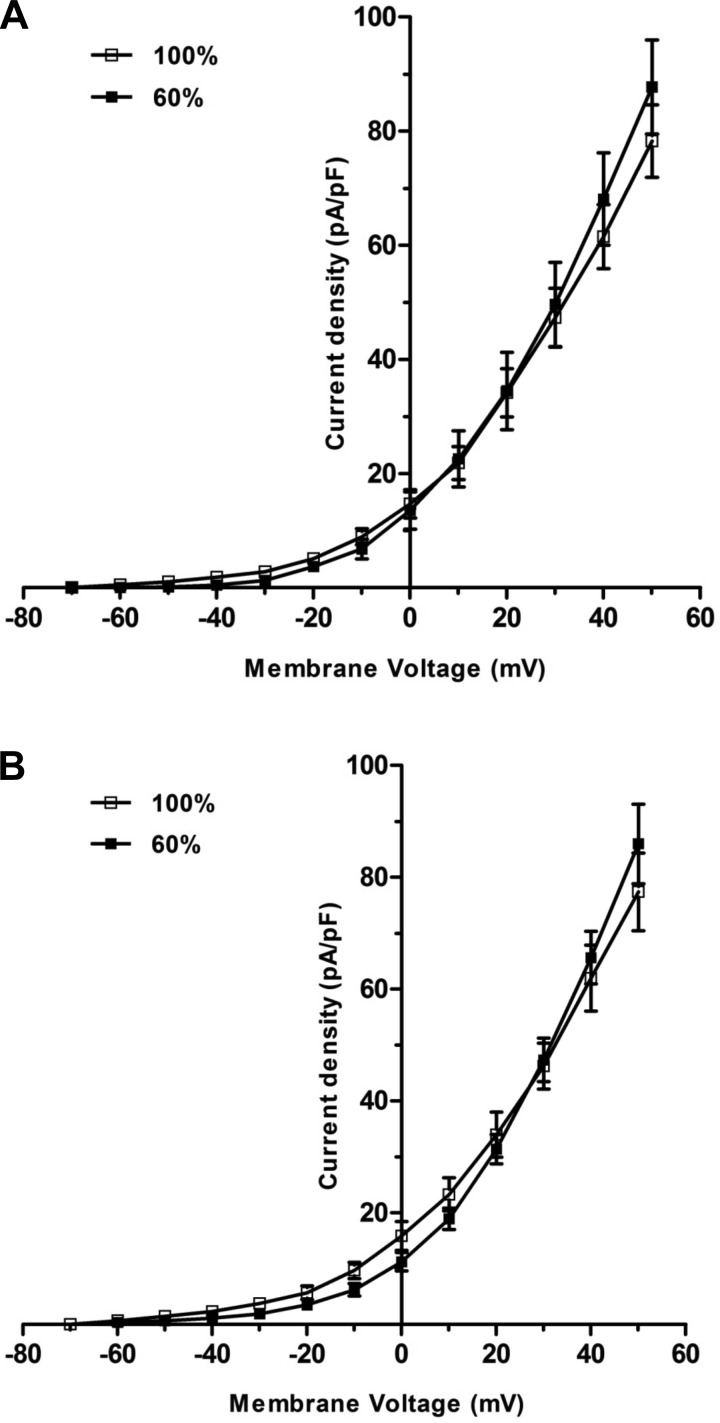
Fig. 6.
The I/V relationship curves for whole-cell BKCa currents obtained in the presence of (A) NS1619 (10−5 M) or (B) 14,15-EET (10−6 M) in freshly isolated fetal coronary smooth muscle cells from ewes fed a control (100%) or nutrient-restricted diet (60%) during the last ⅔ of pregnancy. Each point represents the mean ± SE; n = 6.

