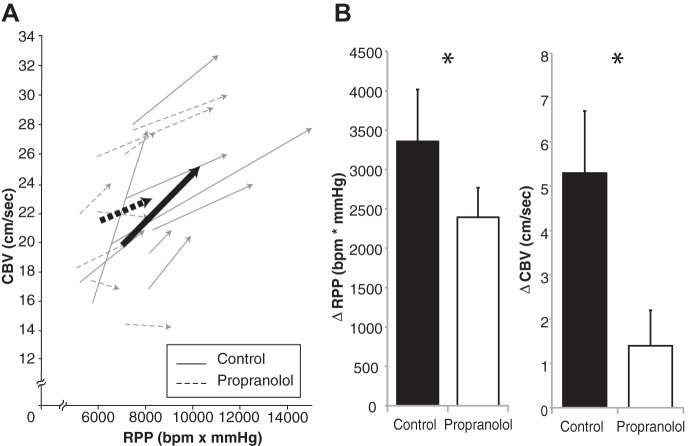
Fig. 4.
A: individual coronary O2 demand (RPP, x-axis) and coronary O2 supply (CBV, y-axis) are displayed for experiment 2. The arrows point from baseline to the peak of handgrip exercise; bold lines represent group averages. Note that the slopes of the control trials are significantly more steep (more coronary hyperemia) than the slopes of the propranolol trials (2.1 ± 0.63 vs. 0.43 ± 0.37 arbitrary units, P = 0.041). B: mean changes in RPP and CBV in response to Cold + Grip protocol. *Difference between treatments.

