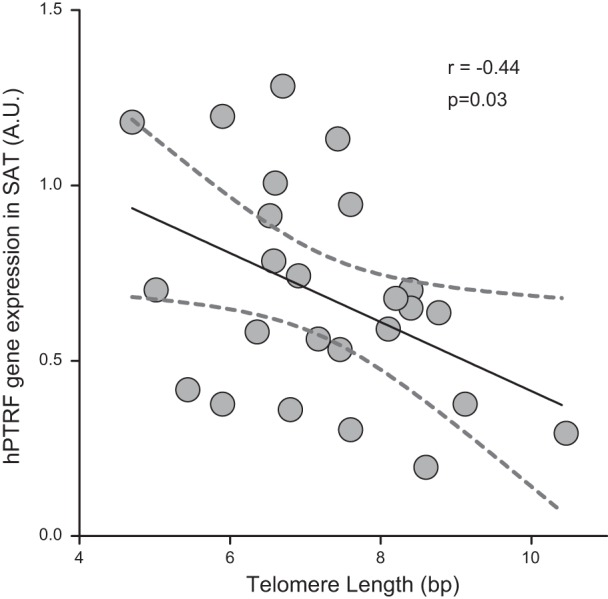
Figure 6.

Negative correlation between telomere length and mRNA levels of PTRF in human subcutaneous adipose tissue (SAT). Graph shows linear regression lines (solid trace) and the 95% confidence bands (dashed traces). Each dot corresponds to 1 individual (n=25). r, Pearson coefficient; A.U., arbitrary units.
