
Figure 3.
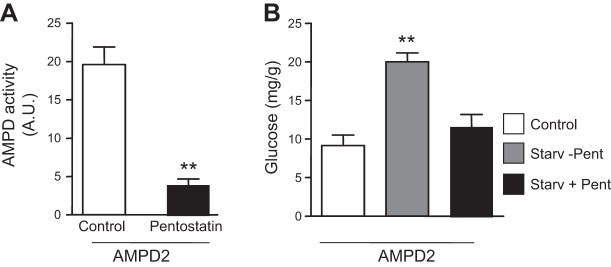
Inhibition of AMPD activity results in blockade of gluconeogenesis. A) Total AMPD activity in HepG2 cells stably overexpressing AMPD2 control (white bar) or in the presence of the AMPD inhibitor pentostatin (100 μM, black bar). **P < 0.01 vs. control. B) Glucose production in HepG2 cells stably overexpressing AMPD2 (right) in control conditions (white bar), in serum-free medium supplemented with lactate, pyruvate, and Bt2-cAMP alone (gray bar), or in the presence of pentostatin (100 μM, black bar). **P < 0.01 vs. control and serum-free medium plus pentostatin.