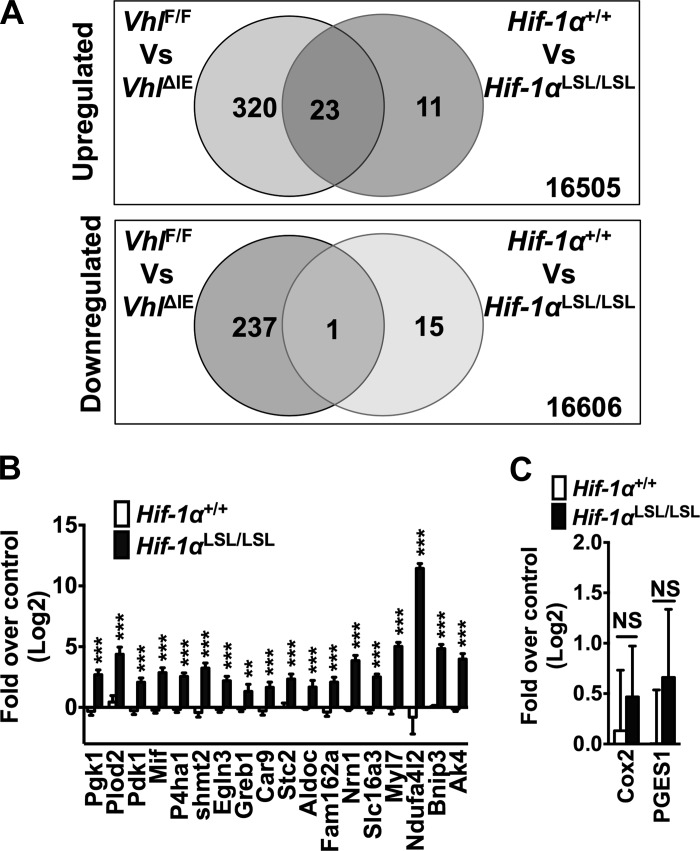
Fig. 2.
Gene expression analyses in the colon from Hif-1αLSL/LSl mice. A: global gene expression profiling in colon RNAs isolated from Hif-1αLSL/LSL mice compared with Hif-1α+/+ and VhlΔIE mice. B: qPCR analysis for selected genes from the microarray data set in colons from Hif-1αLSL/LSL and littermate control mice. C: qPCR analysis of cyclooxygenase (COX)-2 and prostaglandin E synthase 1 (PGES1). 6 mice were assessed per each group. Gene expression was normalized to β-actin, and each bar represents the mean value ± SD. **P < 0.05, ***P < 0.01, compared with Hif-1α+/+ mice.

