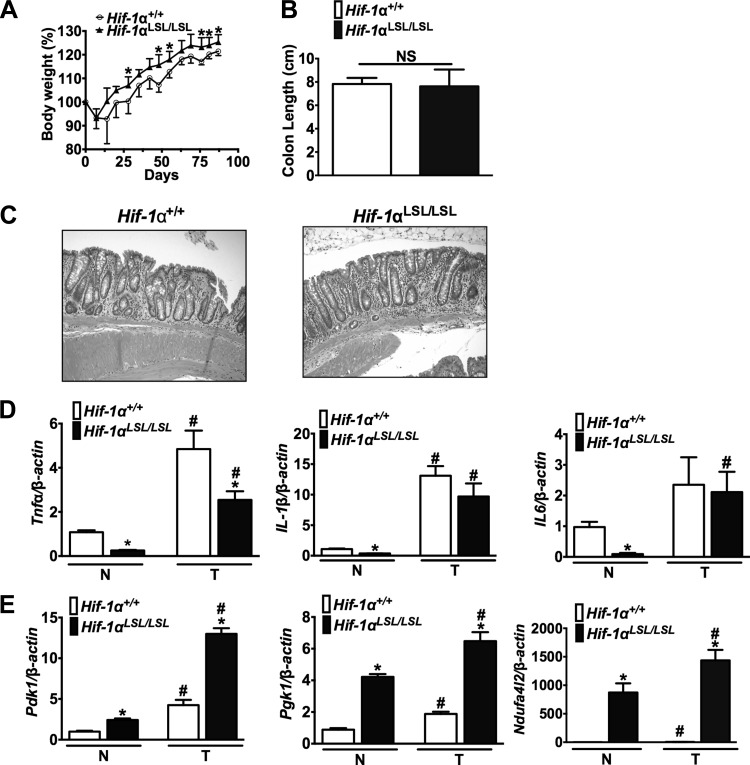
Fig. 5.
Activation of HIF-1α in mouse models of colitis-associated colon cancer (CAC). Body weight (A), colon length (B), representative H&E-stained colon section (C), and qPCR analysis of inflammatory (D) or metabolic genes (E) from Hif-1αLSL/LSL and Hif-1α+/+ mice in normal (N) and tumor (T) tissue following azoxymethane (AOM)/dextran sulfate sodium (DSS) model of colon cancer. Gene expression analysis is normalized to β-actin, and each bar represents the mean value ± SD. *P < 0.01, compared with normal or tumor tissues from Hif-1α+/+ mice. #P < 0.01, compared with normal tissues from Hif-1αLSL/LSL and Hif-1α+/+ mice. 5–8 mice were assessed per each group.

