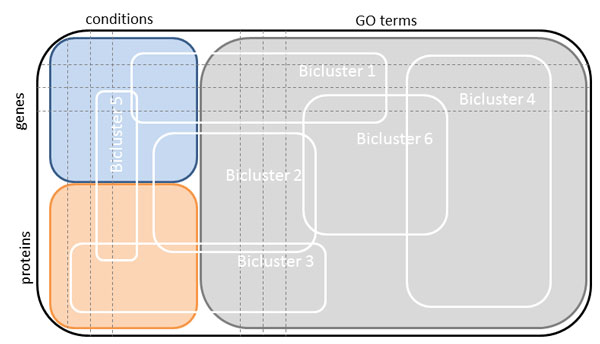
Figure 3.

Block diagram of IBC. The gene expression matrix (blue) contains the genes in the rows and the conditions in the columns. The protein expression matrix (orange) contains the proteins in the rows and the conditions in the columns. The conditions in our study correspond to the life cycle stages of P. falciparum. Genes and proteins annotated to the considered GO terms are gathered in a separate matrix (gray). The three matrices are combined to a new matrix, which is subjected to biclustering. The resulting biclusters can include genes, proteins, conditions, GO terms or any combination of these.
