
Figure 4.
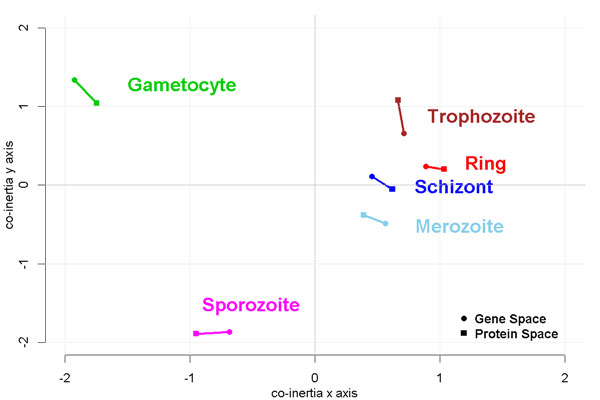
Co-inertia analysis - results. CIA offers the possibility to visualize the gene and protein space projections of the six life cycle stages of P. falciparum in one plot. The projection in gene space are represented by circles and in the protein space by squares. For each life cycle stage, the two corresponding projections are connected through a line. We observe that the y axis separates the intraerythrocytic cycle from the stages gametocyte and sporozoite.