
Figure 2.
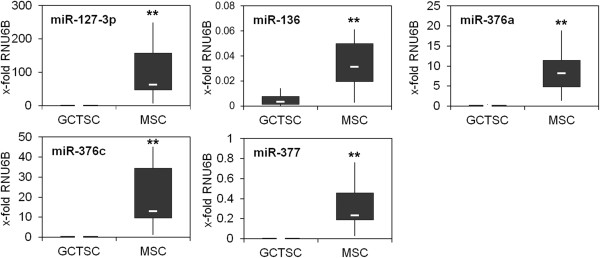
Silencing of specific microRNAs in GCTSCs. Total RNA including microRNAs was extracted from cultured GCTSCs (n = 10) and MSCs (n = 10) and expression of microRNAs was quantified relative to the expression of the small nuclear RNA RNU6B. The white lines indicate the median, the lower and upper boundaries of the box indicate the 25th and 75th percentile. The whiskers indicate the highest and lowest values. (**p < 0.01 determined by Mann–Whitney-U test).