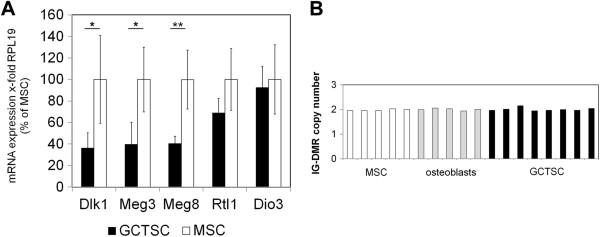
Figure 3.

Significant downregulation of Dlk1, Meg3 and Meg8 in GCTSCs. (A) Expression of Dlk1, Meg3, Meg8, Rtl1 and Dio3 was analyzed by RT-qPCR in GCTSCs (n = 5) and MSCs (n = 5). Data were normalized on the basis of the ribosomal protein L19 (RPL19) expression in the corresponding sample. Data are presented as mean ± SD. (*p < 0.05 **p < 0.01 determined by Mann–Whitney-U test). (B) IG-DMR copy number assay. The IG-DMR copy number was determined by RT-qPCR in MSCs, GCTSCs and osteoblasts and calculated using the genomic RNAse P region as reference.
