
Figure 3.
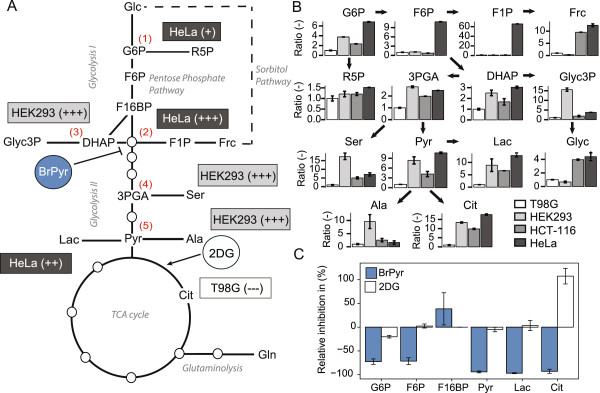
Application of pSIRM for tracking carbon routing and monitoring influence of inhibitor treatment in cell cultures. (A) Scheme of the central carbon metabolism (CCM) and branching points of glycolysis (1 to 5). Summarized are the results of the analyses of carbon routing in different cell lines and the impact of BrPyr or 2DG (T98G only) on CCM. (B) Quantification of 13C6-glucose incorporation within metabolic intermediates (labeled quantities) of T98G, HEK293, HeLa, and HCT-116 cells. Arrows between metabolites indicate links within the biochemical network. The data are presented relative to the T98G cells. (C) Visualization of the results of the pSIRM analysis of BrPyr- and 2DG-treated T98G cells.