Figure 2.

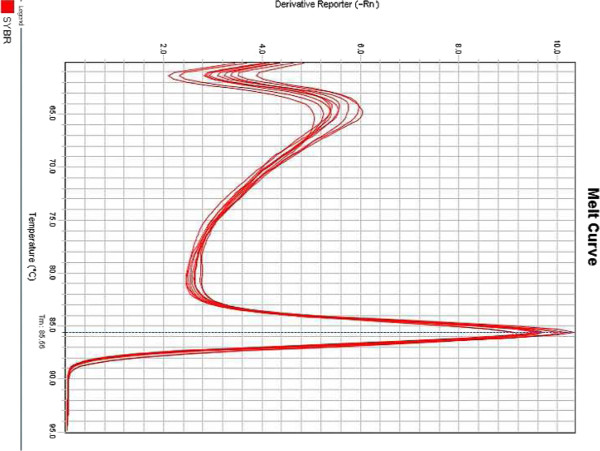
Dissociation curve of the HIV-1 reference standards. The negative first derivative of fluorescent signal (Y-axis) was plotted against Temperature (X-axis).

Dissociation curve of the HIV-1 reference standards. The negative first derivative of fluorescent signal (Y-axis) was plotted against Temperature (X-axis).