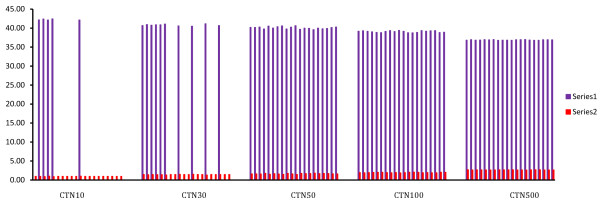
Figure 3.

Bar diagram used for finding the detection limit of the assay. Log concentration of the dilution series plotted with their corresponding Threshold Cycles. Series 1: Threshold Cycles; Series 2: Log concentration of viral load; CTN10: 10 HIV-1 RNA copies/ml; CTN30: 30 HIV-1 RNA copies/ml; CTN50: 50 HIV-1 RNA copies/ml; CTN100: 100 HIV-1 RNA copies/ml; CTN500: 500 HIV-1 RNA copies/ml.
