Figure 1.

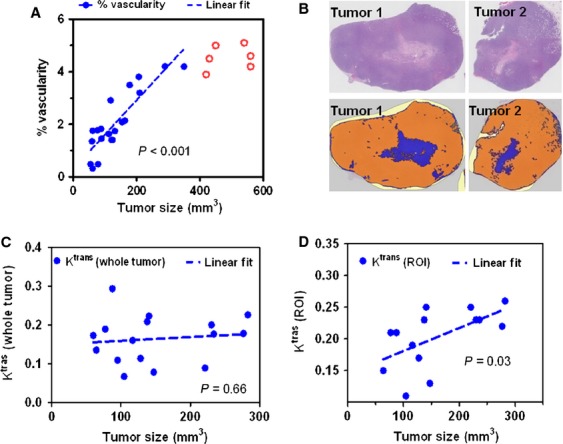
Characterization of nontreated MDA-MB-231 Luc tumor vasculature. (A) Power Doppler ultrasound imaging was performed to assess the tumor vascularity. (B) H & E staining (top panel) by Definiens imaging (bottom panel) analysis depicts the increased necrosis region (blue section in bottom panel) when tumor size was enlarged. DCE-MRI was performed to measure the Ktrans values. The tumor sizes failed to show a correlation with the Ktrans values from the whole tumor (C), whereas demonstrated a linear correlation with Ktrans values from ROIs (D).
