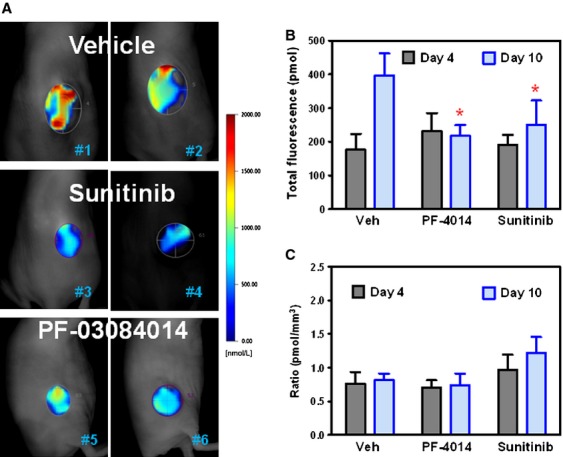
Figure 3.

FMT quantitative imaging analysis of the changes in vascular density after treatment with PF-03084014 and sunitinib in the MDA-MB-231 Luc xenograft model. Tumor bearing mice under treatment were imaged on day 4 and day 10 after dosing initiation. At 24 h before the imaging scan, mice were i.v. injected with AngioSense680 EX. N = 8 mice/group. In B and C, values are expressed as the mean ± SEM. (A) Representative FMT images from each group on day 10. (B) The total florescence was quantified by the total pixels within the regions of interest around each tumor. (C) The relative tumor vascular density was estimated by the total fluorescence values normalized to tumor volume (pmoles/mm3).
