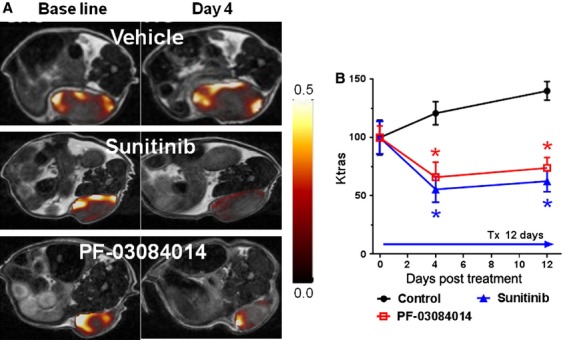
Figure 6.

The effects of PF-03084014 and sunitinib on MDA-MB-231Luc tumor vasculature using DCE-MRI. Tumor bearing mice under treatment were imaged on day 0, 4, and 10 after dosing initiation. (A) Representative images of Ktrans maps of each group on days 0 and 5. (B) The time course of the changes in the Ktrans (ROI) values demonstrate the treatment effect on functional tumor vasculatures. N = 6 mice/group. Values are presented as the mean ± SEM.
