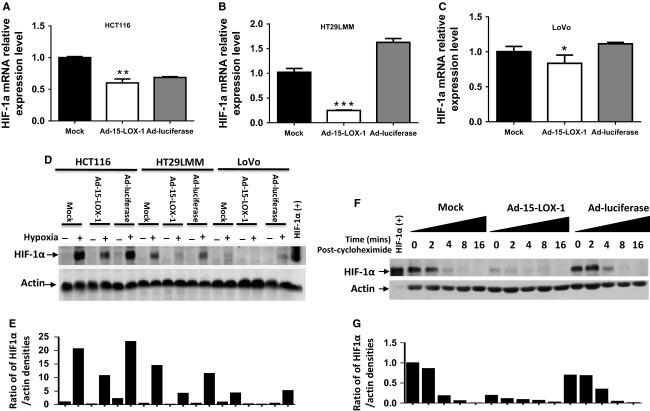
Figure 5.
Effect of 15-LOX-1 on HIF-1α expression and its stability in colon cancer cells. (A–C) The indicated cell lines were transfected with Ad-luciferase, Ad-15-LOX-1, or mock and cultured under hypoxia for 24 h. Cells were harvested and HIF-1α mRNA levels measured by real-time RT-PCR. ***P < 0.0001, **P = 0.0001, *P = 0.02, compared with the Ad-luciferase group. (D–E) Effects of 15-LOX-1 on HIF-1α protein expression in colon cancer cells. HCT116, HT29LMM, or LoVo cells were transfected and grown under hypoxia as in panel A–C but for 48 h. Whole cell lysate proteins were analyzed by Western blotting for HIF-1α. Positive controls are from HeLa cells treated with 0.4 mmol/L CoCl2 for 4 h under hypoxia. For all three tested cell lines, the Ad-15-LOX-1 group had significantly lower HIF-1α protein expression levels than either the mock or the Ad-luciferase group. Repeated experiments showed similar results. (E) Densitometry quantitative analyses of protein bands shown in Figure 5D, values are presented as ratios of HIF-1α to actin. (F–G) HCT116 cells were transfected and grown under hypoxia as in panel D and then exposed to room air in the presence of 10 μg/mL cycloheximide for the indicated times. Whole cell lysate proteins were analyzed by Western blotting for HIF-1α. For all three tested cell lines, the Ad-15-LOX-1 group had significantly lower HIF-1α protein stability than either the mock or the Ad-luciferase group, especially for the first 2 h. Repeated experiments showed similar results. (G) Densitometry quantitative analyses of protein bands shown in Figure 5F, values are presented as ratios of HIF-1α to actin.

