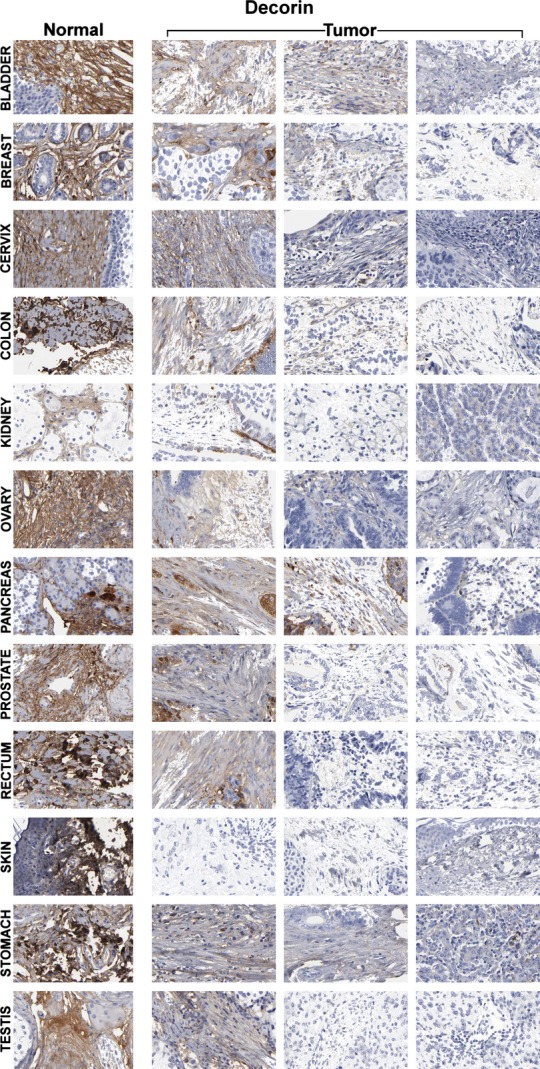
Figure 1.

Decorin comparison between different tissues. Images were taken from the Human Protein Atlas (http://www.proteinatlas.org) online database. Each row represents a different tissue and each individual image in the montage represents a tissue sample from a different patient. The first column shows normal tissues whereas the last three columns show the corresponding tumor samples. Decorin is strongly expressed in the stroma of the normal tissues but its expression is significantly reduced and even absent in the tumor samples.
